- 新增
psqi_raw_data
1. 連續型 Y:直接用 ΔPSQI (最直觀,也最不會被挑)
計算:ΔPSQI = PSQI_(T3) − PSQI_(T1),整數沒關係。
在結果與討論裡,用 MCID 文獻來幫你詮釋數字大小:
失眠 RCT 常用 3 分變化當「最小重要改變」(MIC),2.5–2.7 分當 MCID 10。
某些疾病族群(如肩袖修補術後)算出的 PSQI MCID 約 4.4 分,PASS(可接受狀態)約為 PSQI 5.5 分 11。
寫法示意:
-「本研究以 T3–T1 的 PSQI 差值作為連續結局變項。先前失眠介入試驗多採用約 3 分的 PSQI 變化作為最小臨床重要改變(MIC),以及約 2.5–2.7 分的組間差值作為 MCID 參考 1011。」
這個做法:模型乾淨、訊息完整,只要在 text 裡補一句「怎麼解讀 1 分、2 分、3 分」即可。

2. 類別型 Y:依「是否達到臨床重要變化」分組
利用文獻常見的門檻(約 3 分)1011,把 ΔPSQI 整數變化切成幾類,適合做邏輯斯或多項式 logistic。

一個實務上很常見的切法:

類別 定義(以 ΔPSQI = T3−T1) 解釋 Citations
明顯改善 ΔPSQI ≤ -3 達到 MIC 的改善 1011
穩定 -2 ≤ ΔPSQI ≤ +2 未達 MIC,視為穩定/誤差範圍 1011
明顯惡化 ΔPSQI ≥ +3 達到 MIC 的惡化 1011
Figure 1 依 MCID 概念將 PSQI 變化分為三類

你可以:

把它當作 3 類 Y(multinomial),或
合併成「有臨床重要變化(|Δ|≥3)」vs「無」(二元)。
寫法示意:
「參考先前針對失眠治療試驗對 PSQI 所報告之 MIC / MCID 約 2.5–3 分 1011,本研究將 |ΔPSQI| ≥ 3 分視為具臨床意義之變化,並進一步區分為改善(≤ -3 分)與惡化(≥ +3 分)。」

3. 以「壞睡 vs 好睡」或「達到 PASS 與否」當 Y
再多一種選擇,若你對「是否從壞睡轉成好睡」有興趣:

好睡/壞睡 cut-off:

多數 PSQI 研究以 >5 分定義壞睡 161218。
你可以定義:「從 PSQI >5 變成 ≤5」= 睡眠恢復;反之為新發壞睡。
PASS 概念:

肩袖修補研究中,PSQI 在 6 個月時 ≤5.5 分被視為病人可接受狀態 (PASS) 11。
你可以定義「T3 時 PSQI ≤5 或 ≤5.5」= 達到可接受睡眠狀態(Y=1),否則 Y=0。


4. 次要分析:畫「睡眠軌跡」群組
若有多個時間點(T1、T2、T3),也可學長期追蹤文獻,把人分成幾條軌跡 17:

一直都好睡(PSQI ≤5 維持)
一直都壞睡(PSQI >5 維持,且 |ΔPSQI| <3)
壞睡 → 明顯改善(起始 PSQI >5,且 ΔPSQI ≤ -3)
好睡 → 明顯惡化(起始 ≤5,且 ΔPSQI ≥ +3)
這些可以當作 descriptive 或 exploratory 分析,幫你故事更完整。
方法1: delta_psqi_t3_t1 :PSQI_T3 - PSQI_T1
- 117筆
/Users/yuchi/PycharmProjects/PsyMl_ISI/.venv/bin/python /Users/yuchi/PycharmProjects/PsyMl_ISI/學長/lasso_ranking_delta_psqi.py
[模式] 排除模式
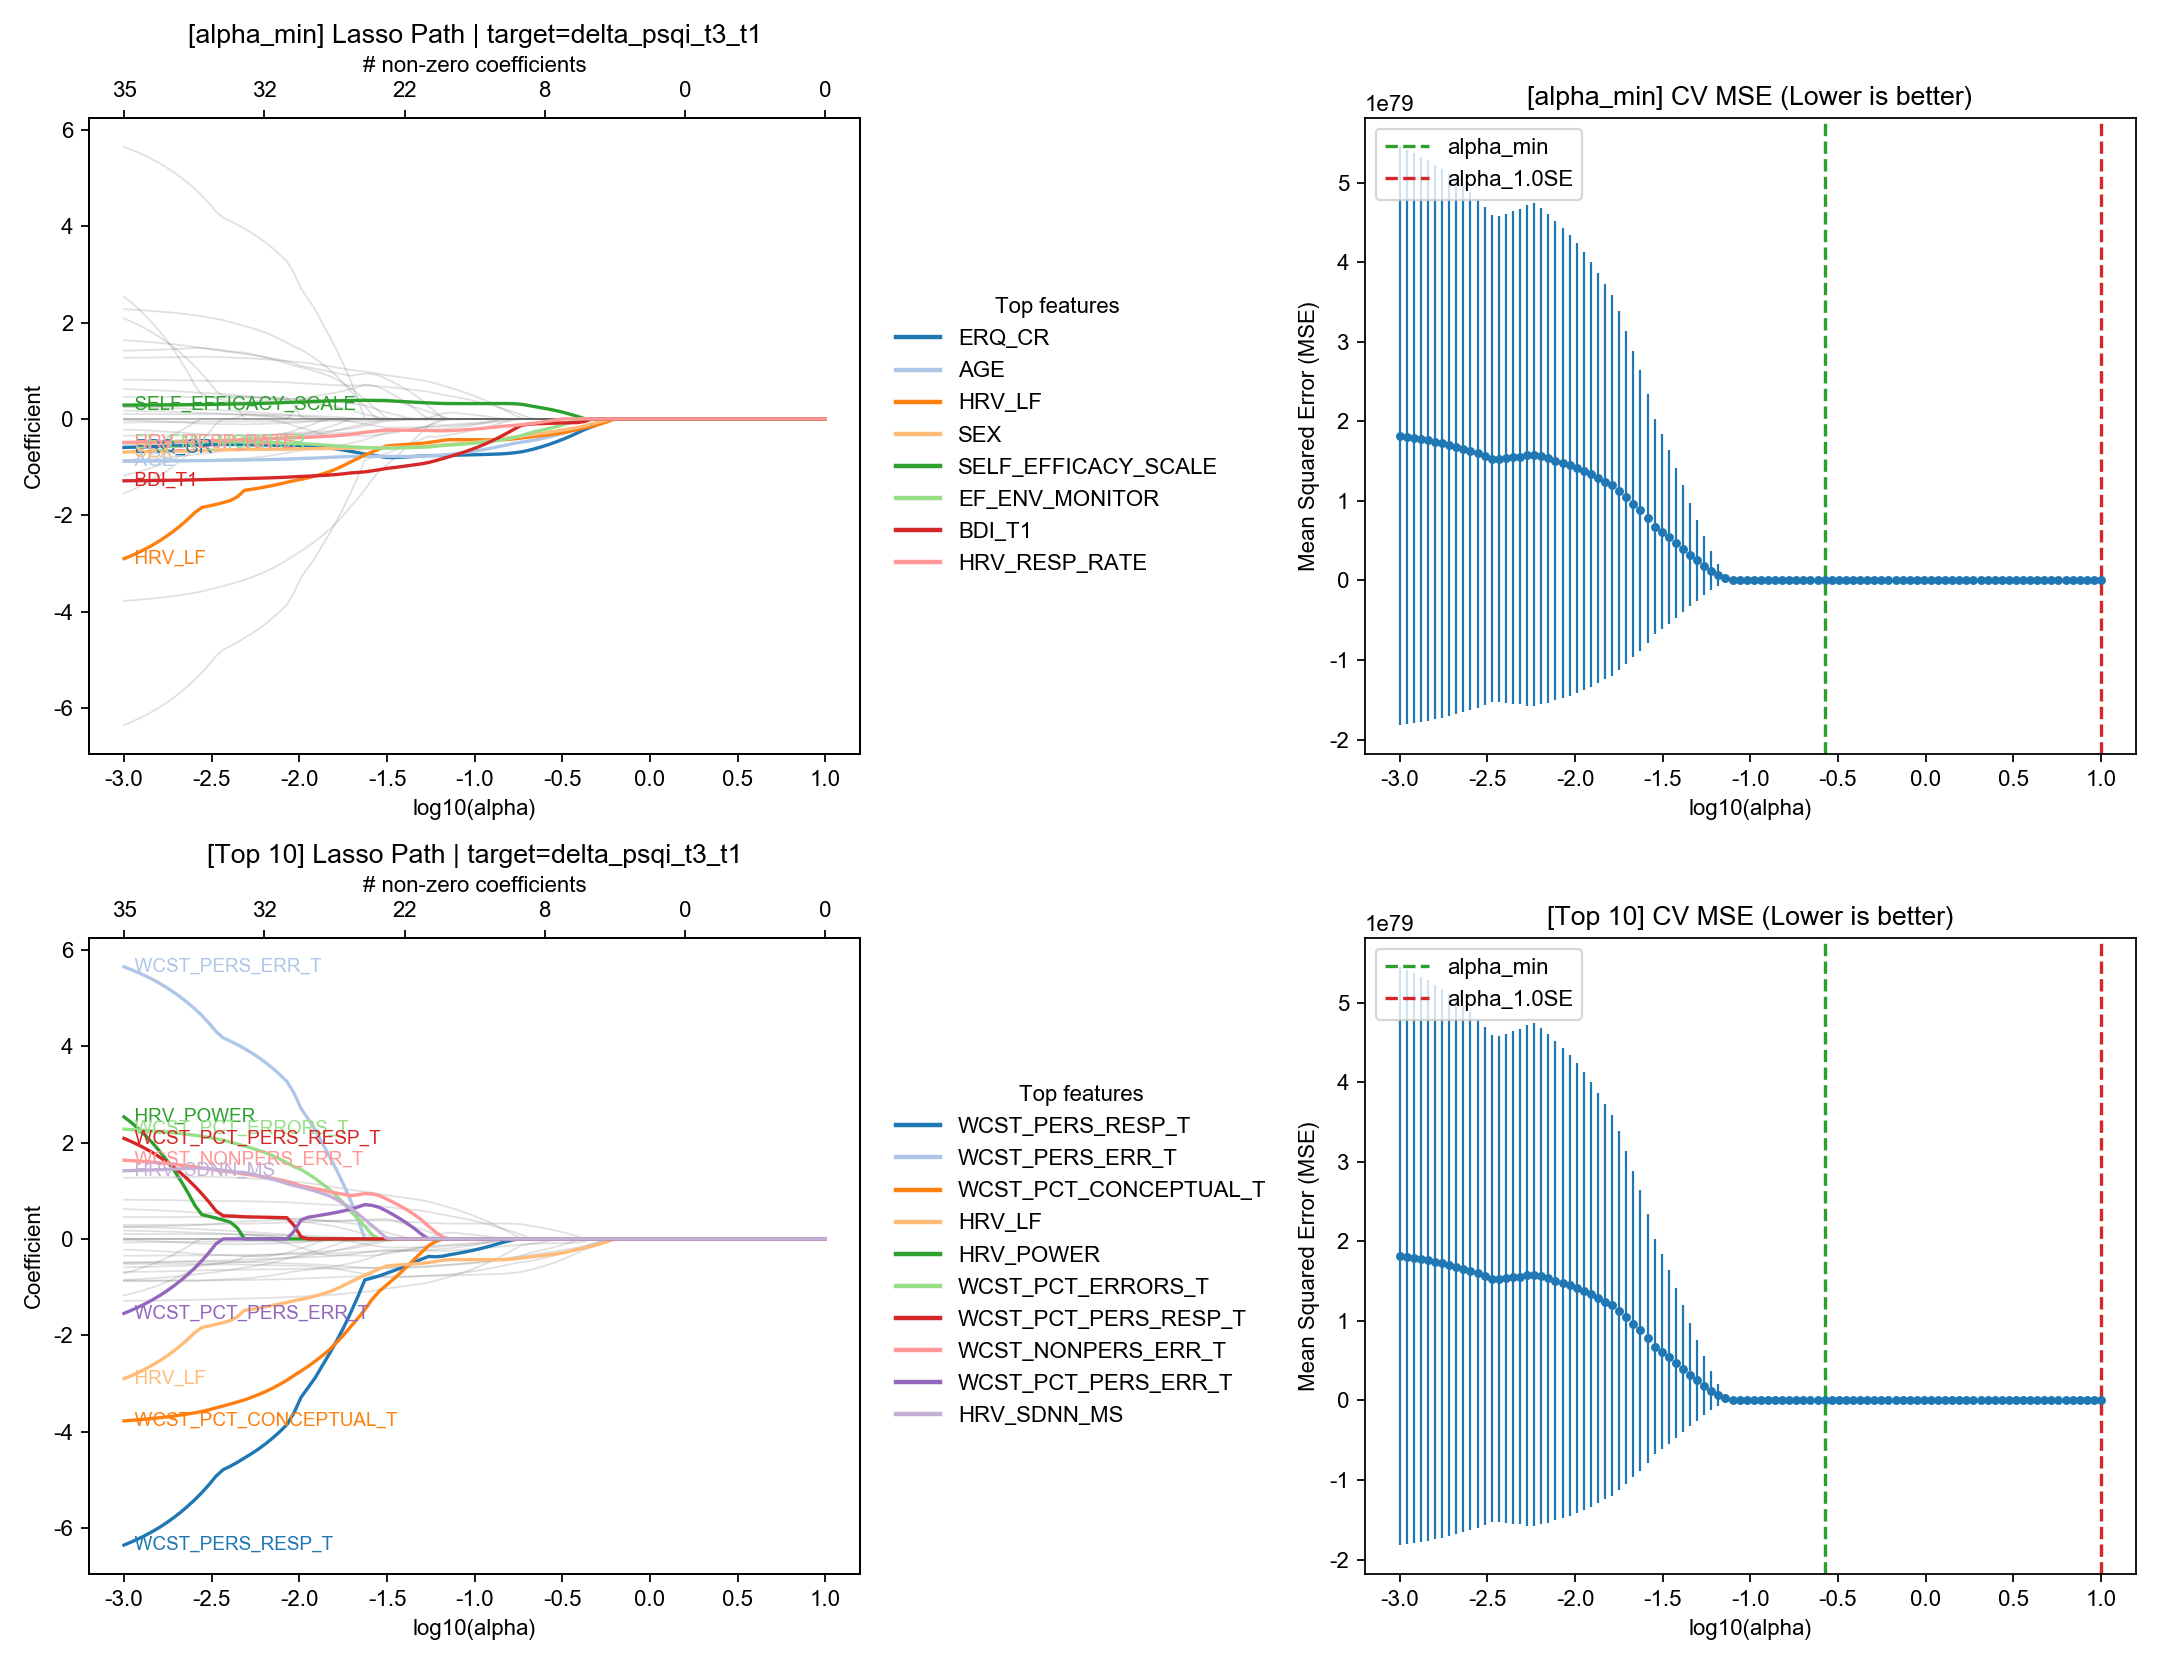
[資料] 來源=psqi_raw_data 目標=delta_psqi_t3_t1 (Regression)
樣本=117 特徵=37
總缺值比例:11.13%
[CV結果] (Metric: neg_MSE, larger is better)
alpha_min: 0.265609
alpha_1.0SE: 10
[選入變項 (1.0SE)] (前 30)
(No features selected)
[對照] alpha_min 選入變項數: 8 | alpha_1.0SE 選入變項數: 0
[選入變項 (alpha_min)] (前 30)
coef abs_coef
ERQ_CR -0.529748 0.529748
AGE -0.374757 0.374757
HRV_LF -0.328916 0.328916
SEX -0.277319 0.277319
SELF_EFFICACY_SCALE 0.201226 0.201226
EF_ENV_MONITOR -0.198511 0.198511
BDI_T1 -0.092877 0.092877
HRV_RESP_RATE -0.043986 0.043986
Lasso Regression (非lasso classfication)
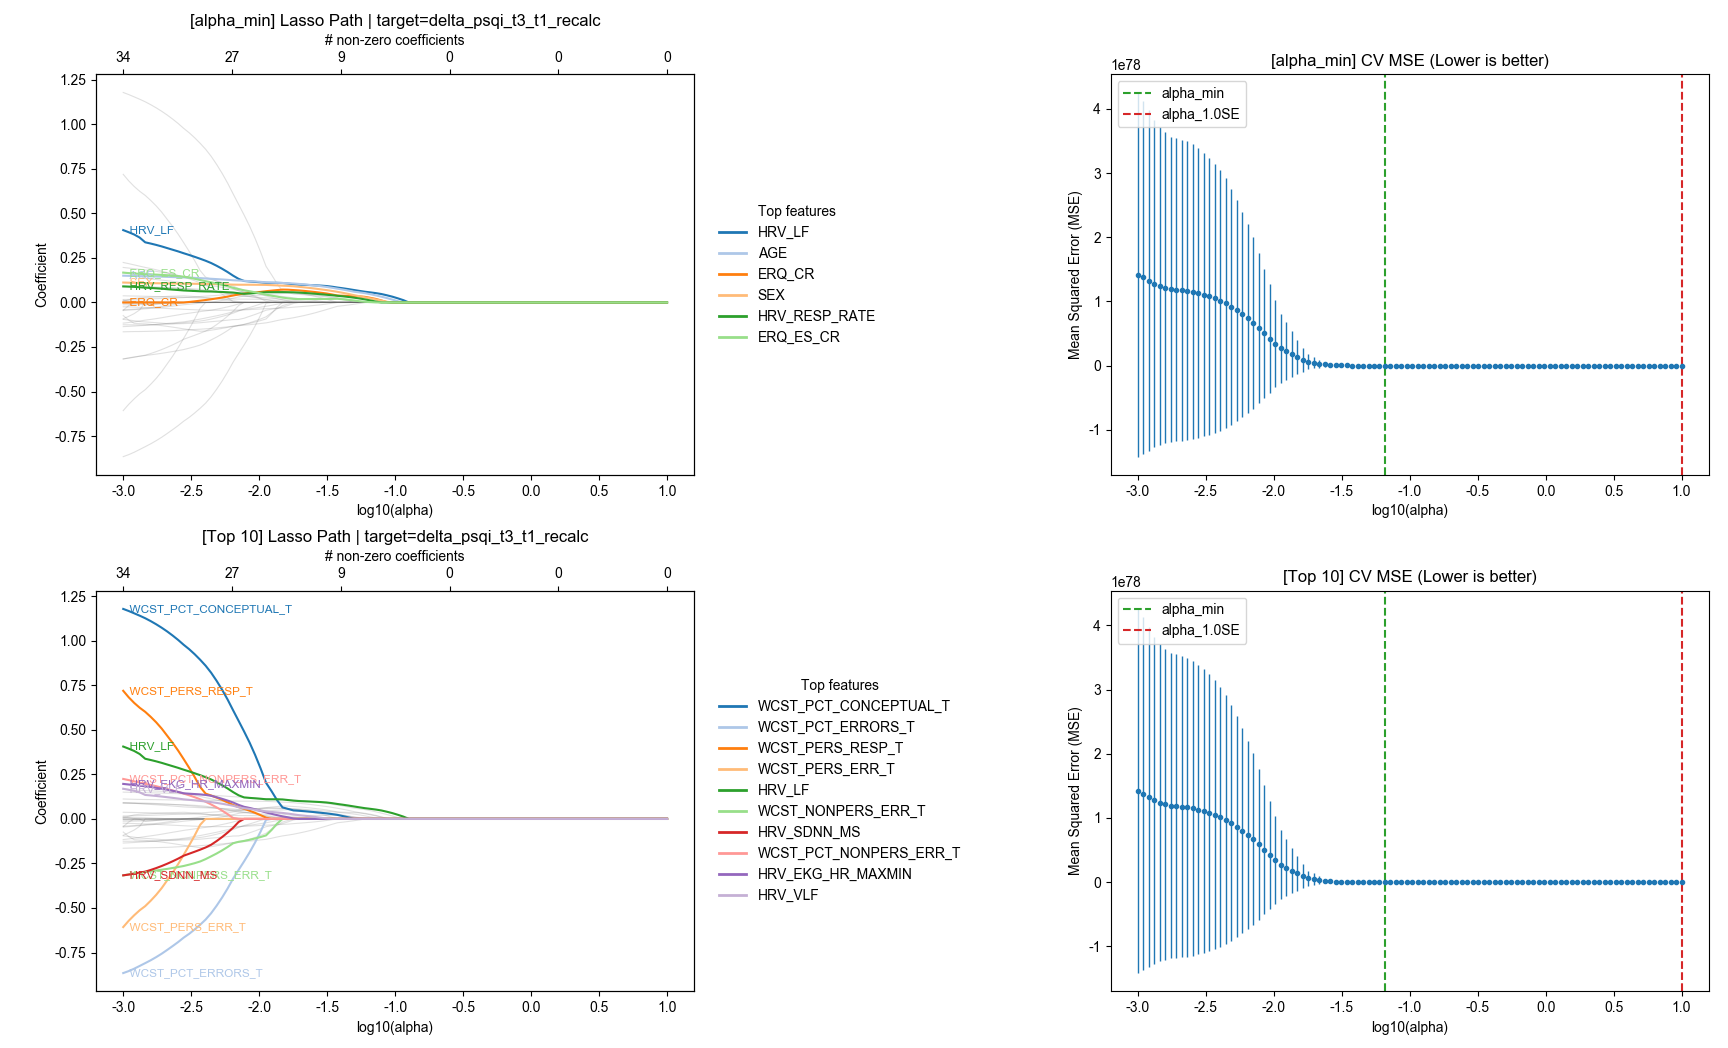
方法2: 重歸納delta_psqi_t3_t1_recalc
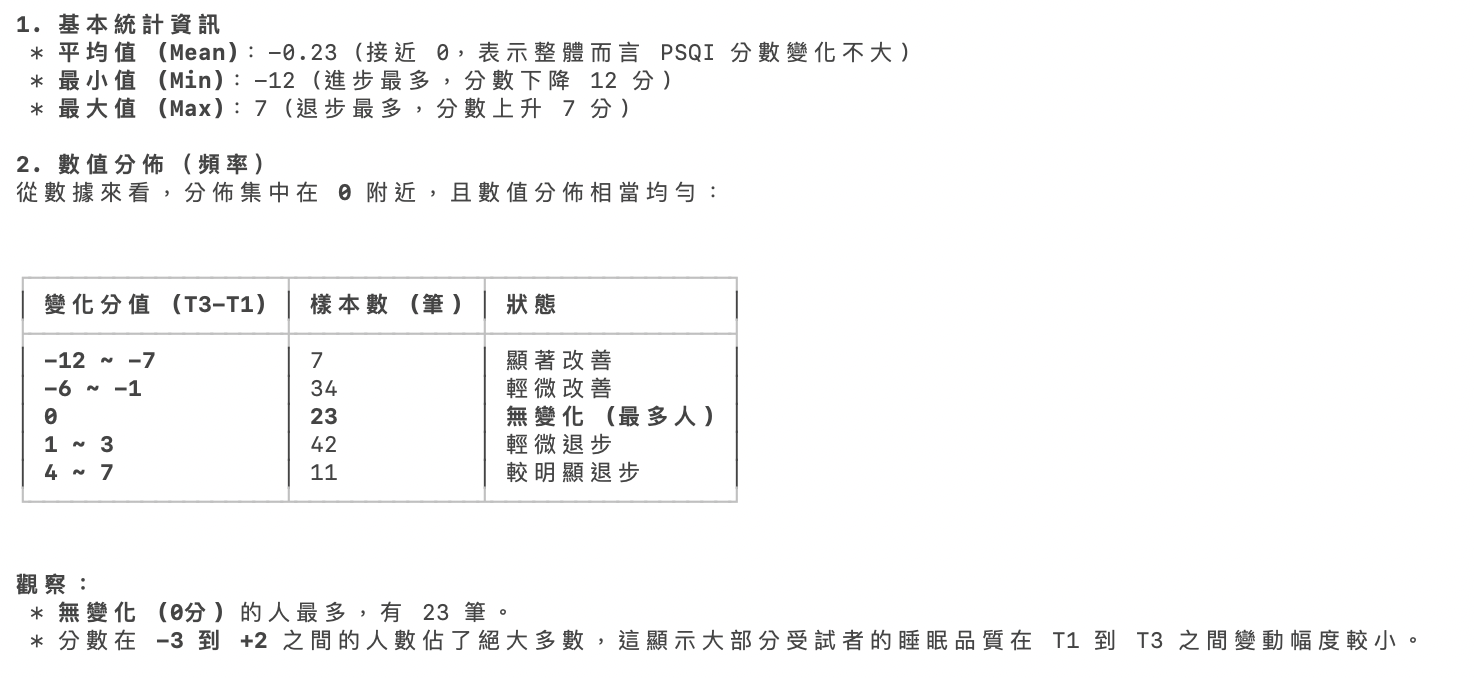
分類規則與結果統計 (共 117 筆):
* 類別 -1(惡化/無改善) (ΔPSQI ≥ +3):20 人
* 類別 0 (持平/微幅波動) (-2 ≤ ΔPSQI ≤ +2):69 人 (佔大多數)
* 類別 1 (明顯改善) (ΔPSQI ≤ -3):28 人
/Users/yuchi/PycharmProjects/PsyMl_ISI/.venv/bin/python /Users/yuchi/PycharmProjects/PsyMl_ISI/學長/lasso_ranking_delta_psqi.py
[模式] 排除模式

[資料] 來源=psqi_raw_data  目標=delta_psqi_t3_t1_recalc (Regression)
  樣本=117  特徵=37
  總缺值比例:11.13%

[CV結果] (Metric: neg_MSE, larger is better)
  alpha_min: 0.0657933
  alpha_1.0SE: 10

[選入變項 (1.0SE)] (前 30)
  (No features selected)

[對照] alpha_min 選入變項數: 6 | alpha_1.0SE 選入變項數: 0

[選入變項 (alpha_min)] (前 30)
                   coef  abs_coef
HRV_LF         0.056423  0.056423
AGE            0.046259  0.046259
ERQ_CR         0.025898  0.025898
SEX            0.022938  0.022938
HRV_RESP_RATE  0.011232  0.011232
ERQ_ES_CR      0.001943  0.001943
方法3
-
13 67人
- < 5 66人
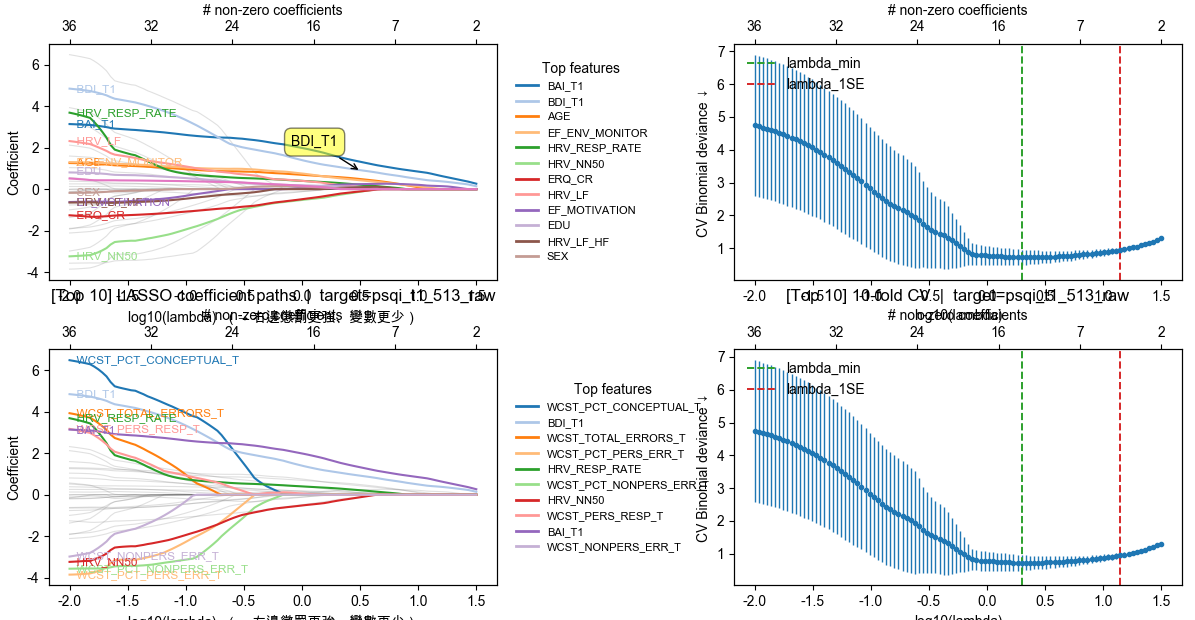
psqi_t1_513_raw
Users/yuchi/PycharmProjects/PsyMl_ISI/.venv/bin/python /Users/yuchi/PycharmProjects/PsyMl_ISI/學長/lasso_ranking_n.py
[模式] 排除模式

[資料] 來源=isi_raw_data  目標=psqi_t1_513_raw  樣本=129  特徵=37
  已排除群組:['ACS', 'CPT', 'EEG', 'IGT', 'ISI', 'PSQI', 'WM']
  總缺值比例:9.47%

[CV結果](分數 = neg_log_loss,越大越好 → log_loss 越小)
  lambda_min:C = 0.503524  |  lambda = 1.986
  lambda_1SE:C = 0.0713732  |  lambda = 14.0109

[選入變項(1SE)] 以 |係數| 排序(前 30)
                       coef  abs_coef
BAI_T1             0.702804  0.702804
BDI_T1             0.401945  0.401945
EF_MOTIVATION      0.157032  0.157032
EF_ENV_MONITOR     0.034605  0.034605
EF_EVERYDAY_SCALE  0.029888  0.029888

[對照] lambda_min 非零變項數:13,lambda_1SE 非零變項數:5

[選入變項(lambda_min)] 以 |係數| 排序(前 30)
                    coef  abs_coef
BAI_T1          1.585108  1.585108
BDI_T1          1.085860  1.085860
AGE             0.586042  0.586042
EF_ENV_MONITOR  0.541940  0.541940
HRV_RESP_RATE   0.304907  0.304907
HRV_NN50       -0.297709  0.297709
ERQ_CR         -0.242679  0.242679
HRV_LF          0.215345  0.215345
EF_MOTIVATION   0.206036  0.206036
EDU             0.142058  0.142058
HRV_LF_HF       0.054875  0.054875
SEX             0.043229  0.043229
ERQ_ES          0.022472  0.022472

[Top 10(路徑峰值)] 不綁定單一 C
 WCST_PCT_CONCEPTUAL_T
                BDI_T1
   WCST_TOTAL_ERRORS_T
   WCST_PCT_PERS_ERR_T
         HRV_RESP_RATE
WCST_PCT_NONPERS_ERR_T
              HRV_NN50
      WCST_PERS_RESP_T
                BAI_T1
    WCST_NONPERS_ERR_T
/Users/yuchi/PycharmProjects/PsyMl_ISI/.venv/bin/python /Users/yuchi/PycharmProjects/PsyMl_ISI/學長/ml_benchmark_modular.py

[資料] 來源=isi_raw_data  目標=psqi_t1_513_raw  列數=128  特徵數=2
[特徵] 使用欄位(前 15):['BDI_T1', 'BAI_T1']
[CV] Stratified 5-fold, seed=42  |  class_weight=balanced
[聚合] K-fold = weighted | LOSO = weighted

[Leakage check] Class balance
                 count  percent%
psqi_t1_513_raw
0                   65      50.8
1                   63      49.2

[Leakage check] 未發現與目標 |r| ≥ 0.95 的欄位。

=== Basic ML Benchmark (Stratified 5-fold CV) ===
             model   AUC  F1_pos(=1)  Prec_pos  Rec_pos  F1_neg(=0)  Prec_neg  Rec_neg   MCC  Accuracy  Pred1_mean  Pred0_mean
LogisticRegression 0.918       0.814     0.873    0.762       0.841     0.795    0.892 0.661     0.828      11.000      14.600
        NaiveBayes 0.910       0.860     0.961    0.778       0.887     0.818    0.969 0.763     0.875      10.200      15.400
               KNN 0.884       0.814     0.873    0.762       0.841     0.795    0.892 0.661     0.828      11.000      14.600
      RandomForest 0.884       0.781     0.769    0.794       0.781     0.794    0.769 0.563     0.781      13.000      12.600
               SVM 0.877       0.842     0.941    0.762       0.873     0.805    0.954 0.731     0.859      10.200      15.400
               MLP 0.855       0.760     0.793    0.730       0.785     0.757    0.815 0.548     0.773      11.600      14.000
           XGBoost 0.855       0.790     0.803    0.778       0.803     0.791    0.815 0.594     0.797      12.200      13.400
      DecisionTree 0.794       0.785     0.761    0.810       0.778     0.803    0.754 0.564     0.781      13.400      12.200

--- Aggregated Confusion Matrix Sums (across all folds' test parts) ---
             model  TN_sum  FP_sum  FN_sum  TP_sum
LogisticRegression      58       7      15      48
        NaiveBayes      63       2      14      49
               KNN      58       7      15      48
      RandomForest      50      15      13      50
               SVM      62       3      15      48
               MLP      53      12      17      46
           XGBoost      53      12      14      49
      DecisionTree      49      16      12      51
[資料] 來源=isi_raw_data  目標=psqi_t1_513_raw  列數=128  特徵數=4
[特徵] 使用欄位(前 15):['BDI_T1', 'BAI_T1', 'EF_MOTIVATION', 'EF_ENV_MONITOR']
[CV] Stratified 5-fold, seed=42  |  class_weight=balanced
[聚合] K-fold = weighted | LOSO = weighted

[Leakage check] Class balance
                 count  percent%
psqi_t1_513_raw
0                   65      50.8
1                   63      49.2

[Leakage check] 未發現與目標 |r| ≥ 0.95 的欄位。

=== Basic ML Benchmark (Stratified 5-fold CV) ===
             model   AUC  F1_pos(=1)  Prec_pos  Rec_pos  F1_neg(=0)  Prec_neg  Rec_neg   MCC  Accuracy  Pred1_mean  Pred0_mean
        NaiveBayes 0.919       0.847     0.909    0.794       0.870     0.822    0.923 0.724     0.859      11.000      14.600
               KNN 0.917       0.824     0.875    0.778       0.847     0.806    0.892 0.675     0.836      11.200      14.400
LogisticRegression 0.908       0.828     0.906    0.762       0.857     0.800    0.923 0.695     0.844      10.600      15.000
      RandomForest 0.898       0.777     0.810    0.746       0.800     0.771    0.831 0.579     0.789      11.600      14.000
               SVM 0.896       0.842     0.941    0.762       0.873     0.805    0.954 0.731     0.859      10.200      15.400
               MLP 0.886       0.758     0.770    0.746       0.773     0.761    0.785 0.531     0.766      12.200      13.400
           XGBoost 0.873       0.784     0.790    0.778       0.794     0.788    0.800 0.578     0.789      12.400      13.200
      DecisionTree 0.828       0.828     0.815    0.841       0.828     0.841    0.815 0.657     0.828      13.000      12.600

--- Aggregated Confusion Matrix Sums (across all folds' test parts) ---
             model  TN_sum  FP_sum  FN_sum  TP_sum
        NaiveBayes      60       5      13      50
               KNN      58       7      14      49
LogisticRegression      60       5      15      48
      RandomForest      54      11      16      47
               SVM      62       3      15      48
               MLP      51      14      16      47
           XGBoost      52      13      14      49
      DecisionTree      53      12      10      53
[資料] 來源=isi_raw_data  目標=psqi_t1_513_raw  列數=128  特徵數=4
[特徵] 使用欄位(前 15):['BDI_T1', 'BAI_T1', 'HRV_NN50', 'HRV_RESP_RATE']
[CV] Stratified 5-fold, seed=42  |  class_weight=balanced
[聚合] K-fold = weighted | LOSO = weighted

[Leakage check] Class balance
                 count  percent%
psqi_t1_513_raw
0                   65      50.8
1                   63      49.2

[Leakage check] 未發現與目標 |r| ≥ 0.95 的欄位。

=== Basic ML Benchmark (Stratified 5-fold CV) ===
             model   AUC  F1_pos(=1)  Prec_pos  Rec_pos  F1_neg(=0)  Prec_neg  Rec_neg   MCC  Accuracy  Pred1_mean  Pred0_mean
LogisticRegression 0.896       0.807     0.857    0.762       0.832     0.792    0.877 0.644     0.820      11.200      14.400
        NaiveBayes 0.890       0.845     0.925    0.778       0.871     0.813    0.938 0.727     0.859      10.600      15.000
               SVM 0.884       0.828     0.906    0.762       0.857     0.800    0.923 0.695     0.844      10.600      15.000
      RandomForest 0.880       0.797     0.817    0.778       0.812     0.794    0.831 0.610     0.805      12.000      13.600
           XGBoost 0.858       0.750     0.738    0.762       0.750     0.762    0.738 0.500     0.750      13.000      12.600
               KNN 0.858       0.803     0.870    0.746       0.835     0.784    0.892 0.646     0.820      10.800      14.800
               MLP 0.844       0.768     0.774    0.762       0.779     0.773    0.785 0.547     0.773      12.400      13.200
      DecisionTree 0.789       0.791     0.773    0.810       0.787     0.806    0.769 0.579     0.789      13.200      12.400

--- Aggregated Confusion Matrix Sums (across all folds' test parts) ---
             model  TN_sum  FP_sum  FN_sum  TP_sum
LogisticRegression      57       8      15      48
        NaiveBayes      61       4      14      49
               SVM      60       5      15      48
      RandomForest      54      11      14      49
           XGBoost      48      17      15      48
               KNN      58       7      16      47
               MLP      51      14      15      48
      DecisionTree      50      15      12      51
[資料] 來源=isi_raw_data  目標=psqi_t1_513_raw  列數=128  特徵數=4
[特徵] 使用欄位(前 15):['BDI_T1', 'BAI_T1', 'IGT_DECK_B', 'IGT_DECK_D']
[CV] Stratified 5-fold, seed=42  |  class_weight=balanced
[聚合] K-fold = weighted | LOSO = weighted

[Leakage check] Class balance
                 count  percent%
psqi_t1_513_raw
0                   65      50.8
1                   63      49.2

[Leakage check] 未發現與目標 |r| ≥ 0.95 的欄位。

=== Basic ML Benchmark (Stratified 5-fold CV) ===
             model   AUC  F1_pos(=1)  Prec_pos  Rec_pos  F1_neg(=0)  Prec_neg  Rec_neg   MCC  Accuracy  Pred1_mean  Pred0_mean
        NaiveBayes 0.927       0.855     0.926    0.794       0.878     0.824    0.938 0.741     0.867      10.800      14.800
LogisticRegression 0.925       0.824     0.875    0.778       0.847     0.806    0.892 0.675     0.836      11.200      14.400
               SVM 0.910       0.797     0.855    0.746       0.826     0.781    0.877 0.629     0.812      11.000      14.600
               MLP 0.908       0.803     0.831    0.778       0.821     0.797    0.846 0.626     0.812      11.800      13.800
      RandomForest 0.891       0.797     0.817    0.778       0.812     0.794    0.831 0.610     0.805      12.000      13.600
           XGBoost 0.880       0.778     0.778    0.778       0.785     0.785    0.785 0.562     0.781      12.600      13.000
               KNN 0.867       0.790     0.839    0.746       0.818     0.778    0.862 0.612     0.805      11.200      14.400
      DecisionTree 0.750       0.746     0.746    0.746       0.754     0.754    0.754 0.500     0.750      12.600      13.000

--- Aggregated Confusion Matrix Sums (across all folds' test parts) ---
             model  TN_sum  FP_sum  FN_sum  TP_sum
        NaiveBayes      61       4      13      50
LogisticRegression      58       7      14      49
               SVM      57       8      16      47
               MLP      55      10      14      49
      RandomForest      54      11      14      49
           XGBoost      51      14      14      49
               KNN      56       9      16      47
      DecisionTree      49      16      16      47
[資料] 來源=isi_raw_data  目標=psqi_t1_513_raw  列數=128  特徵數=5
[特徵] 使用欄位(前 15):['BDI_T1', 'BAI_T1', 'CPT_OMISSION_T', 'IGT_DECK_B', 'IGT_DECK_D']
[CV] Stratified 5-fold, seed=42  |  class_weight=balanced
[聚合] K-fold = weighted | LOSO = weighted

[Leakage check] Class balance
                 count  percent%
psqi_t1_513_raw
0                   65      50.8
1                   63      49.2

[Leakage check] 未發現與目標 |r| ≥ 0.95 的欄位。

=== Basic ML Benchmark (Stratified 5-fold CV) ===
             model   AUC  F1_pos(=1)  Prec_pos  Rec_pos  F1_neg(=0)  Prec_neg  Rec_neg   MCC  Accuracy  Pred1_mean  Pred0_mean
LogisticRegression 0.931       0.829     0.850    0.810       0.842     0.824    0.862 0.672     0.836      12.000      13.600
        NaiveBayes 0.931       0.857     0.911    0.810       0.876     0.833    0.923 0.738     0.867      11.200      14.400
      RandomForest 0.910       0.848     0.855    0.841       0.855     0.848    0.862 0.703     0.852      12.400      13.200
           XGBoost 0.906       0.828     0.815    0.841       0.828     0.841    0.815 0.657     0.828      13.000      12.600
               SVM 0.899       0.797     0.855    0.746       0.826     0.781    0.877 0.629     0.812      11.000      14.600
               MLP 0.889       0.816     0.823    0.810       0.824     0.818    0.831 0.641     0.820      12.400      13.200
               KNN 0.873       0.780     0.836    0.730       0.812     0.767    0.862 0.598     0.797      11.000      14.600
      DecisionTree 0.774       0.772     0.766    0.778       0.775     0.781    0.769 0.547     0.773      12.800      12.800

--- Aggregated Confusion Matrix Sums (across all folds' test parts) ---
             model  TN_sum  FP_sum  FN_sum  TP_sum
LogisticRegression      56       9      12      51
        NaiveBayes      60       5      12      51
      RandomForest      56       9      10      53
           XGBoost      53      12      10      53
               SVM      57       8      16      47
               MLP      54      11      12      51
               KNN      56       9      17      46
      DecisionTree      50      15      14      49
[資料] 來源=isi_raw_data  目標=psqi_t1_513_raw  列數=128  特徵數=3
[特徵] 使用欄位(前 15):['BDI_T1', 'BAI_T1', 'CPT_OMISSION_T']
[CV] Stratified 5-fold, seed=42  |  class_weight=balanced
[聚合] K-fold = weighted | LOSO = weighted

[Leakage check] Class balance
                 count  percent%
psqi_t1_513_raw
0                   65      50.8
1                   63      49.2

[Leakage check] 未發現與目標 |r| ≥ 0.95 的欄位。

=== Basic ML Benchmark (Stratified 5-fold CV) ===
             model   AUC  F1_pos(=1)  Prec_pos  Rec_pos  F1_neg(=0)  Prec_neg  Rec_neg   MCC  Accuracy  Pred1_mean  Pred0_mean
LogisticRegression 0.923       0.817     0.904    0.746       0.851     0.789    0.923 0.681     0.836      10.400      15.200
        NaiveBayes 0.915       0.857     0.911    0.810       0.876     0.833    0.923 0.738     0.867      11.200      14.400
      RandomForest 0.906       0.836     0.864    0.810       0.851     0.826    0.877 0.688     0.844      11.800      13.800
               SVM 0.904       0.862     0.943    0.794       0.886     0.827    0.954 0.759     0.875      10.600      15.000
           XGBoost 0.900       0.816     0.823    0.810       0.824     0.818    0.831 0.641     0.820      12.400      13.200
               KNN 0.883       0.816     0.823    0.810       0.824     0.818    0.831 0.641     0.820      12.400      13.200
               MLP 0.855       0.812     0.800    0.825       0.812     0.825    0.800 0.625     0.812      13.000      12.600
      DecisionTree 0.835       0.827     0.786    0.873       0.813     0.862    0.769 0.645     0.820      14.000      11.600

--- Aggregated Confusion Matrix Sums (across all folds' test parts) ---
             model  TN_sum  FP_sum  FN_sum  TP_sum
LogisticRegression      60       5      16      47
        NaiveBayes      60       5      12      51
      RandomForest      57       8      12      51
               SVM      62       3      13      50
           XGBoost      54      11      12      51
               KNN      54      11      12      51
               MLP      52      13      11      52
      DecisionTree      50      15       8      55
[資料] 來源=isi_raw_data  目標=psqi_t1_513_raw  列數=128  特徵數=3
[特徵] 使用欄位(前 15):['BDI_T1', 'BAI_T1', 'WM_SCALE_SCORE']
[CV] Stratified 5-fold, seed=42  |  class_weight=balanced
[聚合] K-fold = weighted | LOSO = weighted

[Leakage check] Class balance
                 count  percent%
psqi_t1_513_raw
0                   65      50.8
1                   63      49.2

[Leakage check] 未發現與目標 |r| ≥ 0.95 的欄位。

=== Basic ML Benchmark (Stratified 5-fold CV) ===
             model   AUC  F1_pos(=1)  Prec_pos  Rec_pos  F1_neg(=0)  Prec_neg  Rec_neg   MCC  Accuracy  Pred1_mean  Pred0_mean
LogisticRegression 0.928       0.810     0.845    0.778       0.830     0.800    0.862 0.642     0.820      11.600      14.000
        NaiveBayes 0.915       0.870     0.962    0.794       0.894     0.829    0.969 0.777     0.883      10.400      15.200
               MLP 0.909       0.803     0.797    0.810       0.806     0.812    0.800 0.609     0.805      12.800      12.800
               SVM 0.894       0.814     0.920    0.730       0.853     0.782    0.938 0.685     0.836      10.000      15.600
      RandomForest 0.892       0.803     0.831    0.778       0.821     0.797    0.846 0.626     0.812      11.800      13.800
           XGBoost 0.884       0.813     0.833    0.794       0.827     0.809    0.846 0.641     0.820      12.000      13.600
               KNN 0.880       0.800     0.885    0.730       0.837     0.776    0.908 0.649     0.820      10.400      15.200
      DecisionTree 0.774       0.779     0.750    0.810       0.768     0.800    0.738 0.549     0.773      13.600      12.000

--- Aggregated Confusion Matrix Sums (across all folds' test parts) ---
             model  TN_sum  FP_sum  FN_sum  TP_sum
LogisticRegression      56       9      14      49
        NaiveBayes      63       2      13      50
               MLP      52      13      12      51
               SVM      61       4      17      46
      RandomForest      55      10      14      49
           XGBoost      55      10      13      50
               KNN      59       6      17      46
      DecisionTree      48      17      12      51
-
delta_psqi_t3_t1_recalc_new -
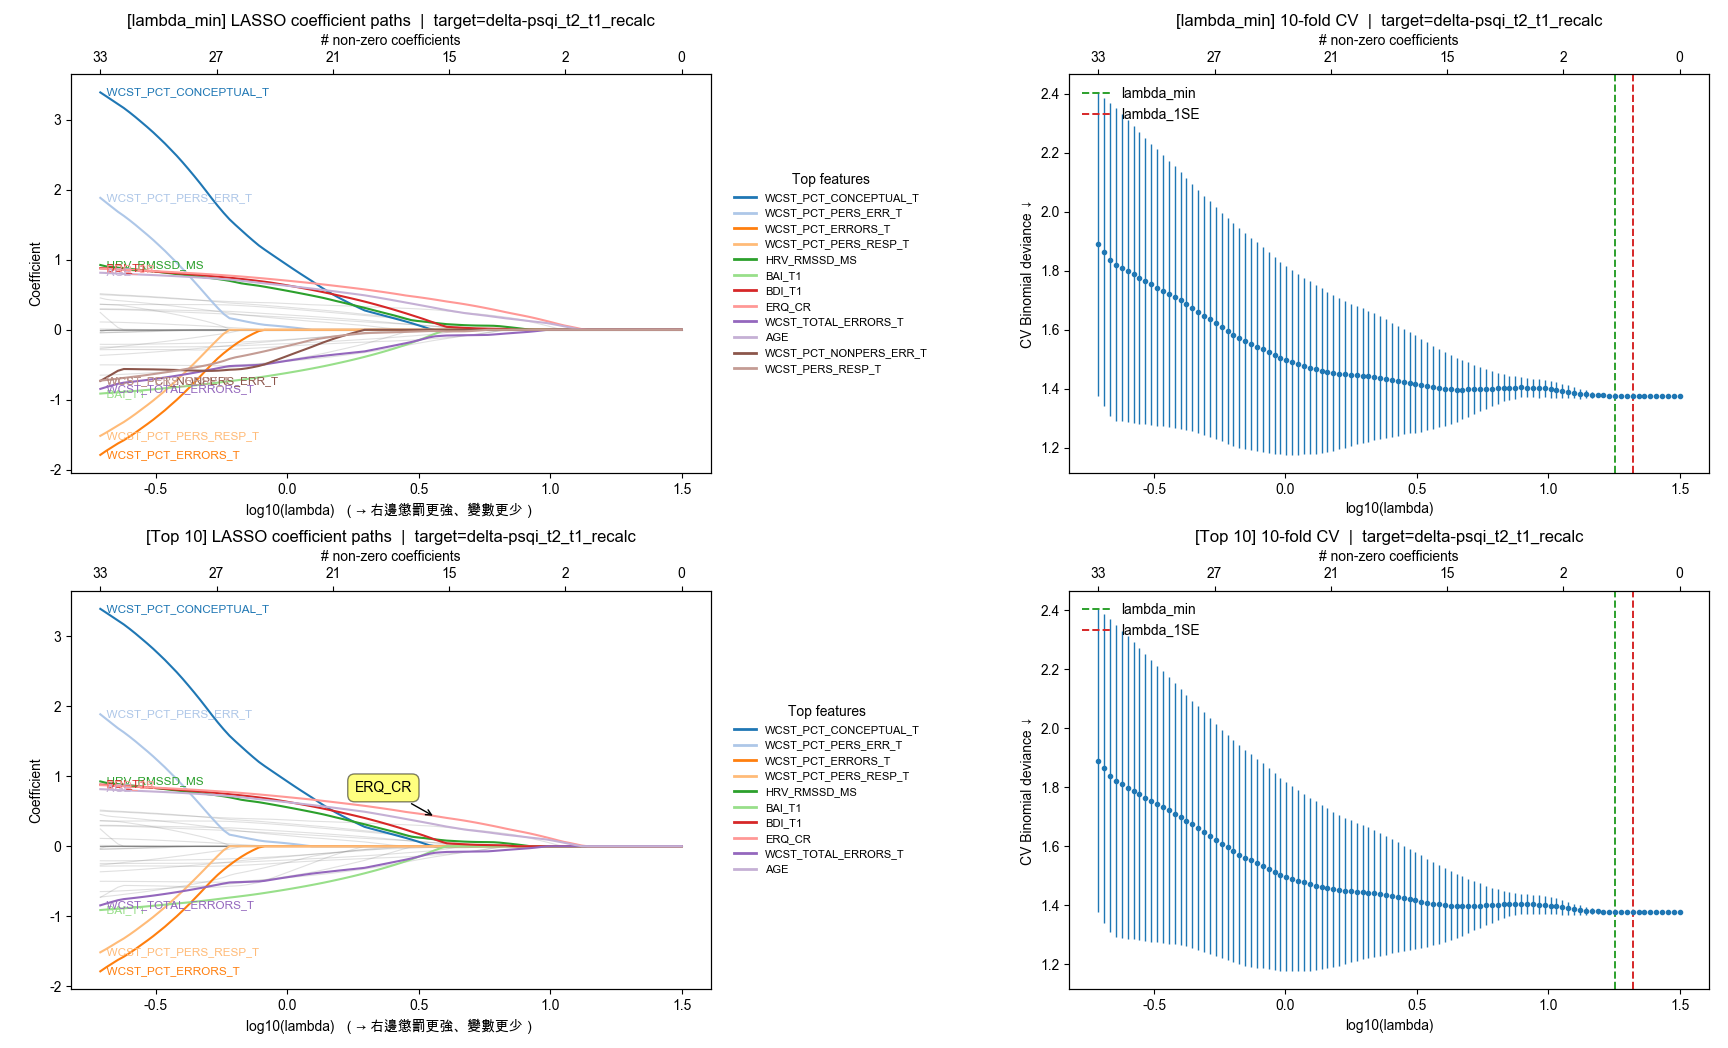
delta-psqi_t2_t1_recalc -
2:
/Users/yuchi/PycharmProjects/PsyMl_ISI/.venv/bin/python /Users/yuchi/PycharmProjects/PsyMl_ISI/學長/lasso_ranking_n.py
[模式] 排除模式

[資料] 來源=isi_raw_data  目標=delta-psqi_t2_t1_recalc  樣本=145  特徵=37
  已排除群組:['ACS', 'CPT', 'EEG', 'IGT', 'ISI', 'PSQI', 'WM']
  總缺值比例:8.16%

[CV結果](分數 = neg_log_loss,越大越好 → log_loss 越小)
  lambda_min:C = 0.0556867  |  lambda = 17.9576
  lambda_1SE:C = 0.0477231  |  lambda = 20.9542

[選入變項(1SE)] 以 |係數| 排序(前 30)
  (無變項被選入;可放寬正則或檢查特徵)

[對照] lambda_min 非零變項數:0,lambda_1SE 非零變項數:0

[Top 10(路徑峰值)] 不綁定單一 C
WCST_PCT_CONCEPTUAL_T
  WCST_PCT_PERS_ERR_T
    WCST_PCT_ERRORS_T
 WCST_PCT_PERS_RESP_T
         HRV_RMSSD_MS
               BAI_T1
               BDI_T1
               ERQ_CR
  WCST_TOTAL_ERRORS_T
                  AGE

进程已结束,退出代码为 0
- t3-t1:
/Users/yuchi/PycharmProjects/PsyMl_ISI/.venv/bin/python /Users/yuchi/PycharmProjects/PsyMl_ISI/學長/ml_benchmark_modular.py

[資料] 來源=isi_raw_data  目標=delta_psqi_t3_t1_recalc_new  列數=71  特徵數=2
[特徵] 使用欄位(前 15):['BDI_T1', 'BAI_T1']
[CV] Stratified 5-fold, seed=42  |  class_weight=balanced
[聚合] K-fold = weighted | LOSO = weighted

[Leakage check] Class balance
                             count  percent%
delta_psqi_t3_t1_recalc_new
0                               37      52.1
1                               34      47.9

[Leakage check] 未發現與目標 |r| ≥ 0.95 的欄位。

=== Basic ML Benchmark (Stratified 5-fold CV) ===
             model   AUC  F1_pos(=1)  Prec_pos  Rec_pos  F1_neg(=0)  Prec_neg  Rec_neg    MCC  Accuracy  Pred1_mean  Pred0_mean
               MLP 0.622       0.609     0.600    0.618       0.630     0.639    0.622  0.239     0.620       7.000       7.200
LogisticRegression 0.602       0.567     0.576    0.559       0.613     0.605    0.622  0.181     0.592       6.600       7.600
           XGBoost 0.539       0.459     0.519    0.412       0.593     0.545    0.649  0.062     0.535       5.400       8.800
      RandomForest 0.525       0.462     0.484    0.441       0.545     0.525    0.568  0.009     0.507       6.200       8.000
      DecisionTree 0.513       0.514     0.500    0.529       0.528     0.543    0.514  0.043     0.521       7.200       7.000
        NaiveBayes 0.503       0.533     0.488    0.588       0.478     0.533    0.432  0.021     0.507       8.200       6.000
               SVM 0.481       0.542     0.640    0.471       0.675     0.609    0.757  0.238     0.620       5.000       9.200
               KNN 0.393       0.417     0.395    0.441       0.400     0.424    0.378 -0.181     0.408       7.600       6.600

--- Aggregated Confusion Matrix Sums (across all folds' test parts) ---
             model  TN_sum  FP_sum  FN_sum  TP_sum
               MLP      23      14      13      21
LogisticRegression      23      14      15      19
           XGBoost      24      13      20      14
      RandomForest      21      16      19      15
      DecisionTree      19      18      16      18
        NaiveBayes      16      21      14      20
               SVM      28       9      18      16
               KNN      14      23      19      15
[資料] 來源=isi_raw_data  目標=delta-psqi_t2_t1_recalc  列數=145  特徵數=2
[特徵] 使用欄位(前 15):['BDI_T1', 'BAI_T1']
[CV] Stratified 5-fold, seed=42  |  class_weight=balanced
[聚合] K-fold = weighted | LOSO = weighted

[Leakage check] Class balance
                         count  percent%
delta-psqi_t2_t1_recalc
0                           65      44.8
1                           80      55.2

[Leakage check] 未發現與目標 |r| ≥ 0.95 的欄位。

=== Basic ML Benchmark (Stratified 5-fold CV) ===
             model   AUC  F1_pos(=1)  Prec_pos  Rec_pos  F1_neg(=0)  Prec_neg  Rec_neg    MCC  Accuracy  Pred1_mean  Pred0_mean
               MLP 0.573       0.600     0.600    0.600       0.508     0.508    0.508  0.108     0.559      16.000      13.000
LogisticRegression 0.552       0.522     0.621    0.450       0.566     0.494    0.662  0.113     0.545      11.600      17.400
               SVM 0.477       0.521     0.576    0.475       0.514     0.468    0.569  0.044     0.517      13.200      15.800
      DecisionTree 0.477       0.458     0.516    0.412       0.466     0.420    0.523 -0.065     0.462      12.800      16.200
        NaiveBayes 0.465       0.638     0.562    0.738       0.362     0.475    0.292  0.033     0.538      21.000       8.000
           XGBoost 0.455       0.510     0.519    0.500       0.421     0.412    0.431 -0.069     0.469      15.400      13.600
      RandomForest 0.445       0.528     0.532    0.525       0.427     0.424    0.431 -0.044     0.483      15.800      13.200
               KNN 0.422       0.551     0.529    0.575       0.390     0.414    0.369 -0.057     0.483      17.400      11.600

--- Aggregated Confusion Matrix Sums (across all folds' test parts) ---
             model  TN_sum  FP_sum  FN_sum  TP_sum
               MLP      33      32      32      48
LogisticRegression      43      22      44      36
               SVM      37      28      42      38
      DecisionTree      34      31      47      33
        NaiveBayes      19      46      21      59
           XGBoost      28      37      40      40
      RandomForest      28      37      38      42
               KNN      24      41      34      46